 |
Detecting induced seismicity and its magnitude-frequency distributionYihe Huang Wednesday, March 4th, 2015 |
||
|
|||
| ABSTRACT
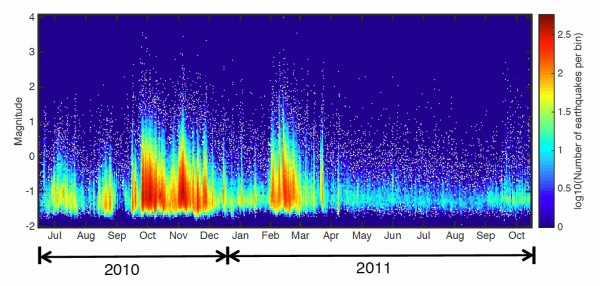
Human activities such as injection and withdrawal of fluids in energy industries make it possible for earthquakes to occur in regions where natural seismicity rate is relatively low. The increase in the number of induced earthquakes is at least partially responsible for the recent surge of seismicity rate in the central U.S., which poses a new type of seismic hazards related to modern energy technologies. A complete catalog of induced earthquakes with accurate estimation of earthquake magnitudes is critical for assessing the risk of ongoing fluid injection. However, due to sparse permanent seismic instrumentation in most of these regions, small earthquakes (Mw<2) are usually missing in traditional catalogs, causing difficulty in monitoring spatial–‐temporal evolution of induced seismicity. We have improved detections of small earthquakes using template–‐matching techniques. Our analysis of the Guy Sequence in central Arkansas results in at least 100 times more earthquakes than recorded by the ANSS catalog and detected ~ 460,000 earthquakes from July, 2010 to October, 2011 (the figure below). The magnitude of completeness of the new catalog is reduced to –‐1, compared to 2 in the ANSS catalog. The temporal evolution of seismicity seems to be correlated with the operation of injection wells, especially high–‐pressure nearby ones. The magnitude–‐ frequency distributions of the induced earthquakes also deviate temporally from the Gutenberg–‐Richter statistics, possibly due to the finiteness of fluid–‐stimulated rock volumes. The overall trend of the reduction of b–‐value may suggest an increase of differential stresses.
|
|||


