The advanced field class, taught by Dave Kimbrough, spent two consecutive weekends in Crown Cove, along the Silver Strand, to conduct a class project. For this project, the students were tasked with assessing the seismic hazard associated with two newly identified faults beneath San Diego Bay (Singleton et al., 2021). In an attempt to image the continuation of the faults on land, students collected seismic refraction data along a 700+ meter stretch of the San Diego Bay shoreline using a new ABEM Terraloc Pro.
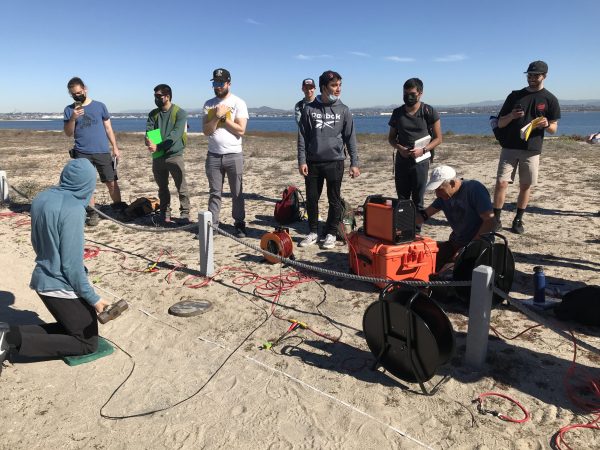
This system uses a 15 lb sledgehammer striking a steel plate to generate seismic energy, which then travels through the subsurface and is recorded by an array of 48 geophones. Dr. Kim Olsen and Dr. Rafael Almeida joined the class to help with data acquisition. In figure 1, undergraduate student Matthew Tingloff (wearing the blue hooded shirt and kneeling) is waiting to generate seismic waves while Dr. Kim Olsen (wearing a white hat) readies the Terraloc to collect data.
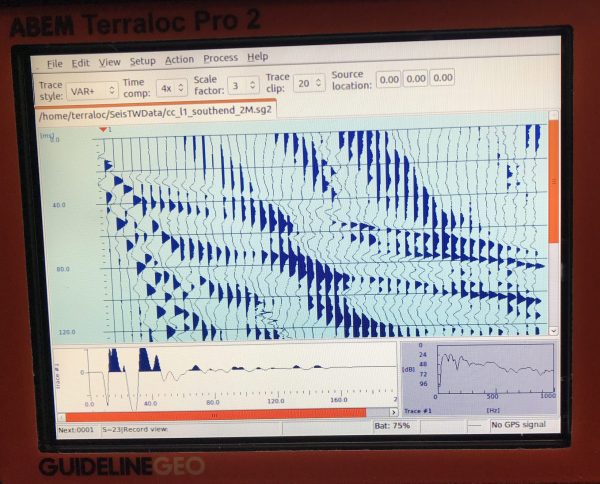
As the seismic waves move through the subsurface they travel within and refract off layers of sediment and return back to the geophones where they are recorded on the Terraloc computer. The waves from each shot or hammer strike are available to analyze within moments. Figure 2 is an example of what the data look like. Each vertical line or wiggle represents one geophone and the wave(s) that are returned to it.
In the data, geologists are able to see or estimate how many layers are in the subsurface. The data also include cars that happen to be traveling along Silver Strand Boulevard during data collection. This extraneous noise is seen in the image above as the thicker bands of blue that seem to pass through the data along a slant from the upper left to the lower right of the image. Students used the collected data, along with some software, to interpret what they think the geology looks like underground. They were most interested in seeing if the two newly identified faults extended on shore.
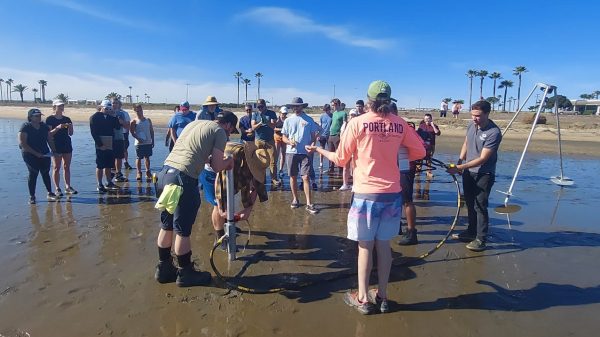
In order to ground truth or verify the seismic data, the students also collected five sediment cores. These cores were collected with the help of Jillian Maloney and her sedimentology and stratigraphy class. Dr. Maloney brought her land based vibracore system which uses a cement mixer to vibrate the core tube into the ground along with a cable ratchet puller and tripod to remove the cores (fig. 3). Cores were sectioned into manageable lengths in the field using a pipe cutter.
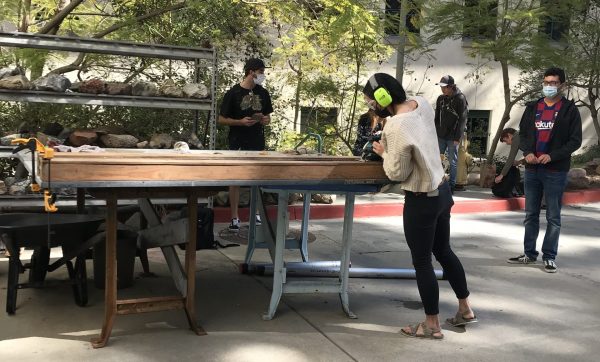
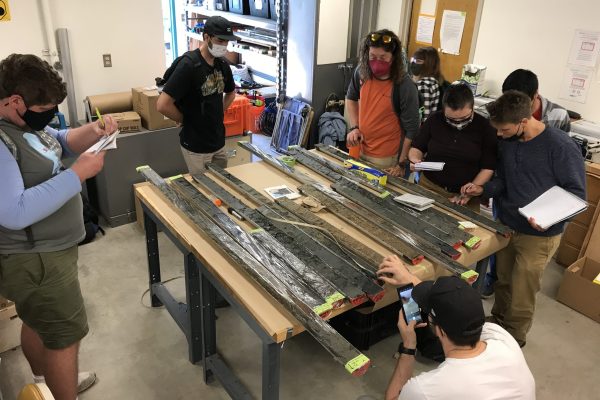
Once back on campus students split the cores in half lengthwise using a circular saw (fig. 4). With the core tubes split, students were able to see the sediment they collected. They then logged the cores, noting any changes in color and texture, locations of fossils and/or shells, along with any sedimentary features (fig. 5). With these logs, the students were able to revisit their models developed from the seismic data and refine their interpretations.
Reference
Singleton, D. M., Maloney, J. M., Brothers, D. S., Klotsko, S., Driscoll, N. W., & Rockwell, T. K. (2021). Recency of faulting and subsurface architecture of the San Diego Bay pull-apart basin, California, USA. Frontiers in Earth Science, 9, 305.
