Definition and Mathematics of Simple Shear
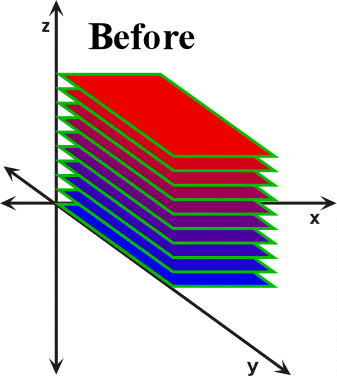
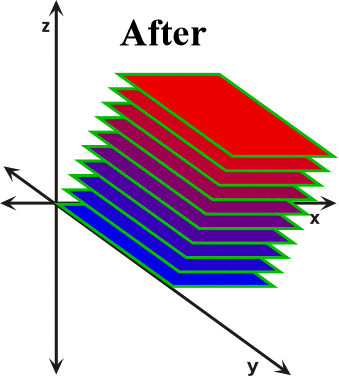
Simple shear is a three-dimensional constant-volume strain (Twiss and Moores, 1992; Ferguson, 1994; Davis and Reynolds, 1996). It is analogous to the process that occurs when you place a deck of cards on a table and then gently press down on the top of the deck and move your hands to the right or left. As you move your hand the top of the deck slides over the lower part, with each successively intervening card sliding over its lower neighbor (Figure 30). A cube subjected to a simple shear event is converted into a parallelogram resulting in a rotation of the finite strain axes. The sides of the parallelogram will progressively lengthen as deformation proceeds but the top and bottom surfaces neither stretch nor shorten. Instead they maintain their original length, which is the length of the edge of the original cube.


Figure 30. In this example, the distortion of a deck of cards by simple shear is modeled. As the top of the deck is moved to the right the lengths of the sides of the deck that are parallel to the Y and X axes do not change, while the lengths that start out parallel to the Z axis increase. Note also that during simple shear the sides of the deck that start out parallel to the Z-axis appear to rotate about the Y-axis as they lengthen.
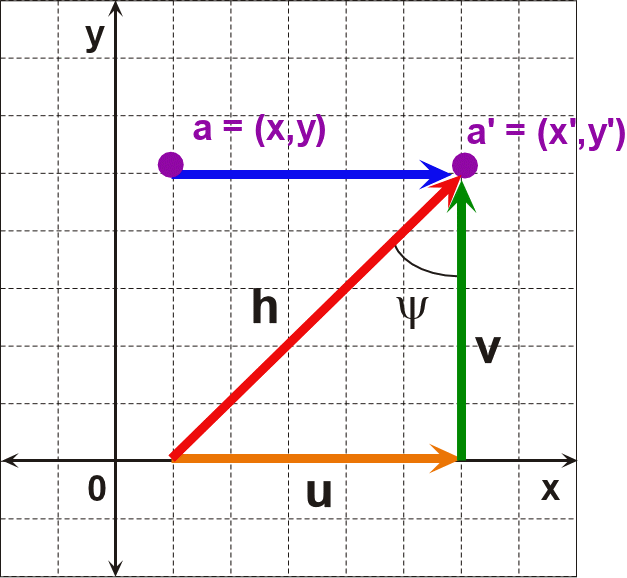
Simple shear describes the change of points in a body relative to each other, and therefore they are described through an internal reference frame (Ferguson, 1994; Davis and Reynolds, 1996; van der Pluijm and Marshak, 1997). For example, consider some point (x, y) lying within a domain of potential simple shear with a coordinate system like that shown in Figure 31. After an increment of strain this point will be translated parallel to the x-axis to some new position (x’, y’).

Figure 31. The translation of point a to illustrate the mathematics of simple shear.
Note that the magnitude of vector v is the distance that the point was translated parallel to the y-axis, while the magnitude of vector u is the distance the point was translated parallel to the x-axis. Vector h then is the resultant of these two vector components. From Figure 31 it should be obvious that
![]()
and
![]()
It therefore follows that
![]()
or, upon simplifying:
![]()
However, by definition
![]()
If y = v as demanded by the geometry of Figure 31, then
![]()
Putting these relationships in terms of coordinate transformations we then have
![]()
and
![]()
Geologists refer to y as angular shear strain and to g as shear strain.
Equations and represent the algorithm utilized in the simple shear component of Visualizing Strain. As shown in Equation , Equations (69) and (70) can be expressed in matrix format (Ferguson, 1994)
![]()
Geologists refer to the 2 x 2 matrix on the right hand side of Equation (71)i.e.,
![]()
as the strain transformation matrix for simple shear.
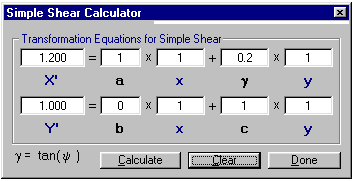
A calculator is provided for the strain transformation equations for simple shear (Figure 32). To access it, from the cascading menu item labeled Calculators, click on Simple Shear Calculator. Enter values for a, b, x, y, and g for both X' and Y' and press Calculate. The new coordinates of the point represented by (x,y) are shown as X' and Y'.

Figure 32. The Simple Shear Calculator.
Visualizing Strain provides an interactive example for visualizing simple shear. In the Visualizing Simple and Pure Shear window of Visualizing Strain click on the radio button next to Simple Shear. From the cascading menu item labeled Experiment, select Plot then Points. This action should result in a plot of a circle with numbered points around the circumference (e.g., the blue circle in Figure 33). How will the individual points around the circumference of the circle behave during simple shear?
In order to answer this question we need to strain the circle by incremental simple shear. We can accomplish this task by selecting Increment from the cascading menu item labeled Experiment and then observe the change in position of the points on the circumference of the circle. The red circle in Figure 33 is the result of several increments of strain by simple shear. Note that all points on the original circle that lie above the y = 0 line have followed straight line paths and have moved to the right. Similarly, all points below y = 0 have followed straight-line paths , but, have moved to the left. Also note that the circle was transformed into an ellipse by simple shear. This ellipse is referred to as the strain ellipse and its maximum and minimum dimensions are the maximum and minimum principal strain directions.

Figure 33. The blue circle in the diagram is the original configuration of the points prior to the simple shear event. The red circle is the result of several increments of strain by simple shear.