Definition and Mathematics of Pure Shear
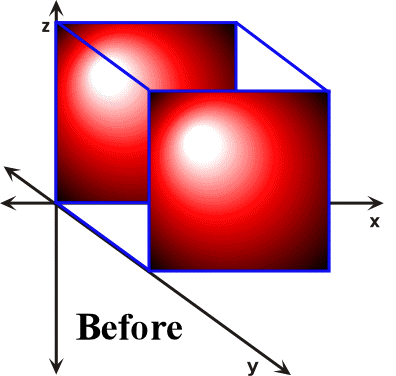
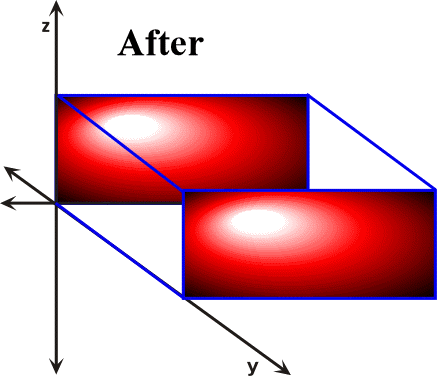
In contrast to simple shear, pure shear is a three-dimensional constant-volume "homogeneous flattening" (Twiss and Moores, 1992). During homogeneous flattening a sphere is transformed into a pancake-like shape and a box is changed into a tablet or book-like form. The cube in Figure 34 is shortened in z direction and elongated in the x and y directions. With pure shear the sides of the cube remain parallel and perpendicular after the strain event.


Figure 34. During pure shear the sides of the cube that are parallel to the z-axis are shortened, while the lengths of the sides that are parallel to the x-axis increase. In contrast, the lengths of the sides of the cube that are parallel to the y-axis remain unchanged. When such geometrical changes occur during the transformation of a rock body to a distorted state then the mechanism of distortion is termed plane strain.
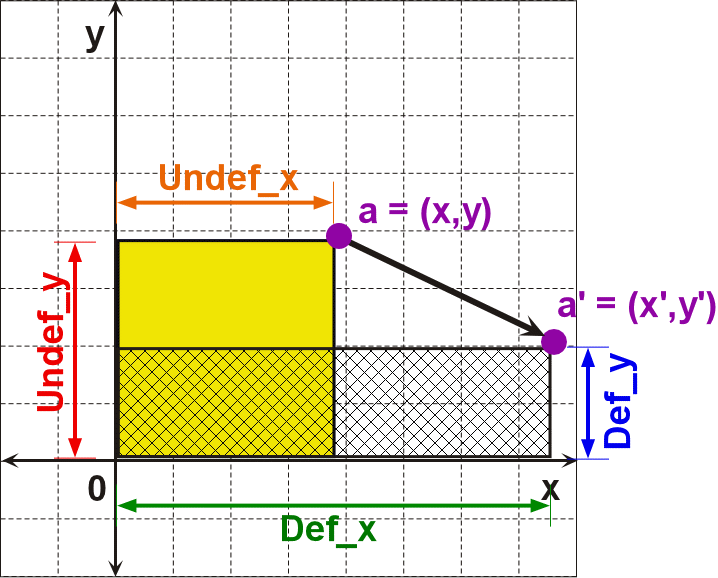
Pure shear like simple shear also describes the change of points in a body relative to each other, and therefore they are described through an internal reference frame (Ferguson, 1994; Davis and Reynolds, 1996; van der Pluijm and Marshak, 1997). The geometry that we will use in analyzing pure shear is shown in Figure 35.

Figure 35. The translation of point a is used to illustrate the mathematics of pure shear.
Note that our starting coordinate is labeled a and during pure
shear it is translated to a’. Defx is the perpendicular
distance from the y-axis to point a’. Undefx
is the perpendicular distance from the y-axis to point a.
The ratio ![]() is the proportional change in position along the x-axis that a
has undergone relative to its original position as it was translated during
pure shear. An important measurement of strain is stretch, which is defined
in Figure 35 as:
is the proportional change in position along the x-axis that a
has undergone relative to its original position as it was translated during
pure shear. An important measurement of strain is stretch, which is defined
in Figure 35 as:
![]()
As shown in the section entitled Measurements of Strain, stretch is also defined as:
![]()
where elongation (e) is expressed as
![]()
Thus, the coordinate transformation equation for x’ is
![]()
In order to obtain the coordinate transformation equation for y’, we first note that pure shear is a constant volume process. Thus, the area occupied by the yellow square in Figure 34 has to be the same as the area of the crosshatched region which represents its deformed equivalent. Mathematically, we then write
![]()
The area of the crosshatched region is
![]()
Thus, we have
![]()
and
![]()
Hence we can write:

Rearranging terms results in
![]()
![]() is the proportional
change in position along the y-axis that a has undergone
relative to its original position as it was translated during pure shear.
We therefore write the coordinate transformation equation for y’
as
is the proportional
change in position along the y-axis that a has undergone
relative to its original position as it was translated during pure shear.
We therefore write the coordinate transformation equation for y’
as

Equations and represent the algorithm utilized in the development of the pure shear component of Visualizing Strain. As shown in Equation , Equations and also can be written in matrix format as follows (Ferguson, 1994)

The 2 x 2 matrix on the right hand side of Equation ,i.e. Equation , is referred to as the strain transformation matrix for pure shear

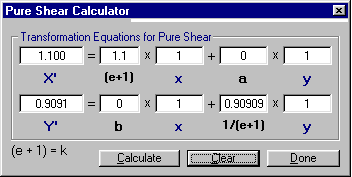
A calculator is provided for the strain transformation equations for pure shear (Figure 36). To access it, from the cascading menu item labeled Calculators, click on Pure Shear Calculator. Enter values for (e+1), x, a, y, and b for X' and Y'. Then press Calculate to see the new positions of the original point (x,y).

Figure 36. The Pure Shear Calculator.
Visualizing Strain provides an interactive example for visualizing pure shear. In the Visualizing Simple and Pure Shear window of Visualizing Strain put a check the radio button next to Pure Shear. From the cascading menu item labeled Experiment, select Plot then Points. This action should result in a plot of a blue colored circle with numbered points along the circumference (Figure 37). During pure shear only lines that are parallel to the maximum and minimum principal strain directions will remain parallel before and after a pure shear event, while all other lines will be either shortened or lengthened. What path then will the points along the unstrained circle follow during pure shear?
In order to answer this question we need to strain the circle by incremental pure shear. We can accomplish this task by selecting Increment from the cascading menu item labeled Experiment and observing the change in position of the points on the circumference of the circle. The red circle in Figure 37 is the result of several increments of strain by pure shear. Upon close scrutiny of the strained circle the observer should note the following.
-
Points 9 and 27 followed straight-line paths parallel to the y-axis and moved toward the origin.
-
Points 18 and 36 followed straight-line paths parallel to the x-axis and moved away from the origin.
-
All other points followed curved paths asymptotic to the x and y axes that in combination either indicate shortening or elongation of the original circle
In addition, the original circle was transformed into an ellipse whose long and short dimensions represent the maximum and minimum principal strain directions respectively.

Figure 37. The blue circle in the diagram is the original configuration of the points prior to the pure shear event.